

Introduction to XesterUI
Hi everyone! This idea really stemmed from the VMworld Hackathon Vegas 2016. Yes, it really took me this much time to get this thing put together. I think that the project was initially intended to be used with Pester and NSX. This new project is a user interface that wraps Vester. The hope is that it will expand to other Powershell unit/integration tests, or configuration management tools. I’d love to start playing with PowerNSX and Vester!! The great part about this tool is that you can share a single interface with a team or group of system administrators, not everyone will need to install and run command line tests. I work on a team of 11 folks with varying levels of skills, this tool allows us to share a single interface to inspect our entire vSphere infrastructure, remediate configuration drifts, report on problems, and compare historical data easily.
Right now the project is completely separate project than Vester. Somewhere in the future we will need to determine what the right model will be and whether or not to start integrating the two code bases. At this time there are no code changes needed in order to run XesterUI on top of Vester.
Side note, I do not claim to be a web developer. I have chosen the WAMP stack because it is very easy for a System Administrator to manage, update, and customize. This tool is intended to be functional first, pretty second. I will take any help I can get with making the pages prettier, but I will not sacrifice looks for the ability of a junior or mid level SA to make changes that could help their organization.
Lastly, this is a Beta release. I’m interested to get feedback on whether this will be useful, or improvements and feature requests, nothing is off the table at this point!
Components/Nomenclature
- TestRun – A set of specified tests that run on specific Targets.
- System – A group of Targets, must contain at least one vCenter
- Target – A single vSphere entity, vCenter, Host, Cluster, vm, etc.
- Queue Manager – Manages the Queue of tests, assigns them to an appropriate TestRun Manager, also aborts cancelled testruns.
- TestRun Manager – A process that can execute a TestRun workflow.
- Workflow – A wrapper script for Vester.
- Database – Collects all of the meta data about the vSphere systems and TestRun results.
- User Interface – Set of web pages where you are able to slice and dice the TestRun data, submit TestRuns, Remediate, etc.
How does it work?
XesterUI simply wraps Vester right now. There is a workflow script that is executed by the TestRun Manager. The wrapper script gets test information from the Database, executes Vester specifying the config.json file and whether or not to remediate problems. After the test completes the script parses the XML result file, and imports the TestRun data as records in the Database. Once the data is imported, the user is free to view, sort, and filter the TestRun data.
Setup/Deployment:
Setup is not difficult, I’m still working on a deployment script (and better documentation) that will make things fairly simple, until then follow these quick directions (and let me know if you have any problems):
Download and install:
- WampServer 2.5 or newer
- PowerWamp project (place in c:\openprojects\PowerWamp)
- PowerLumber project (place in c:\openprojects\PowerLumber)
- XesterUI project (place in c:\openprojects\XesterUI)
- Vester (Follow Brians Instructions, they are great!)
- Powercli 6.5
- Create a ‘C:\XesterUI’ directory for Logs, and TestRun artifacts.
- Copy the XesterUI User Interface directory contents to ‘c:\wamp\www\XesterUI’
- As administrator, run ‘Deploy_Demo_Database.bat’ from ‘c:\openProjects\XesterUI\Database directory’.
- This will insert Sample data that you are free to update!
- Open 2 Powershell console windows, and start the Queue Manager Script in one, TestRun manager in the other (No args needed).
- Use Vester to create a ‘Config.json’ file (again, use Brians Blog).
Lastly, run your first Test (see images below)!
Note: The deployment of Components does not have to all be on the same machine. You can deploy the Queue Manager and TestRun Managers to different machines. Not sure the Queue Manager makes sense at this point. Additionally you can install the ‘AMP’ on a linux host, so long as it will have access to a CIFS share where the log files are accessible to all parties. Setting up multiple TestRun Managers could prove to be very useful if you have multiple sites and low WAN speeds.
Status and Results:
Here is a list of the status and results included in the Sample Data. I Highly recommend you use the default ID’s and Text Status/Result. Feel free to change the HTML color though!
Status: (ID,Text Status, HTML, Text color)
- (1,’Down’,’#CC0000′,’Red’)
- (2,’Up’,’#006633′,’Green’)
- (3,’Starting Up’,’#FFFF00′,’Yellow’)
- (4,’Shutting Down’,’#FF6600′,’Orange’)
- (5,’Submitted’,’#666666′,’Grey’)
- (6,’Queued’,’#FFFFFF’,’White’)
- (7,’Assigned’,’#6699FF’,’SkyBlue’)
- (8,’Running’,’#0066FF’,’Blue’)
- (9,’Complete’,’#00CC66′,’LightGreen’)
- (10,’Cancelled’,’#333333′,’Charcoal’)
- (11,’Enabled’,’#006633′,’Green’)
- (12,’Disabled’,’#CC0000′,’Red’)
Results: (ID,Text Result, HTML, Text color)
- (1,’PASS’,’#006633′,’Green’)
- (2,’FAIL’,’#CC0000′,’Red’)
- (3,’CRITICAL’,’#FFFF00′,’Yellow’)
- (4,’AGENT_ERROR’,’#9933FF’,’Purple’)
- (5,’ABORTED’,’#FF6600′,’Orange’)
- (6,’UNKNOWN’,’#666666′,’Grey’)
sooooo Let’s See It!
Here is the first page you come to when browsing to http://webserver/XesterUI
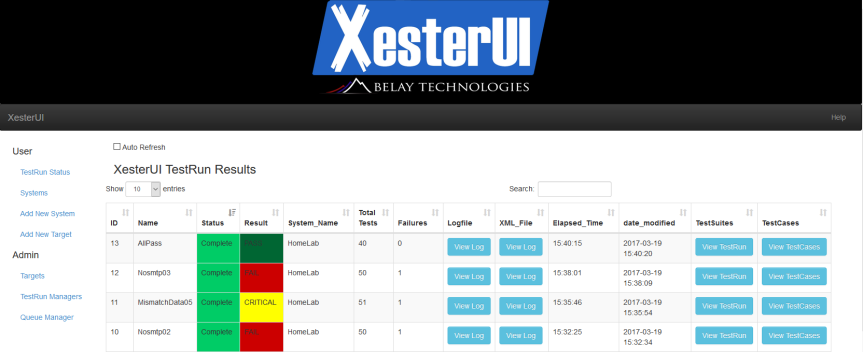
The result of an overall TestRun will bubble up from the lowest test case.
- A critical result means that the Total number of testcases reported in the XML, did not get inserted into the database.
- Pass means that ALL testcases passed, and are accounted for.
- Fail indicates that at least 1 test case has failed.
- Agent_Error indicates that the system failed somewhere.
From this page you have several options, You can view the TestRun logfile, or Result XML.


There are two options for viewing Testcase results for a specific TestRun. Drilling down by TestSuite, or viewing all Testcases.


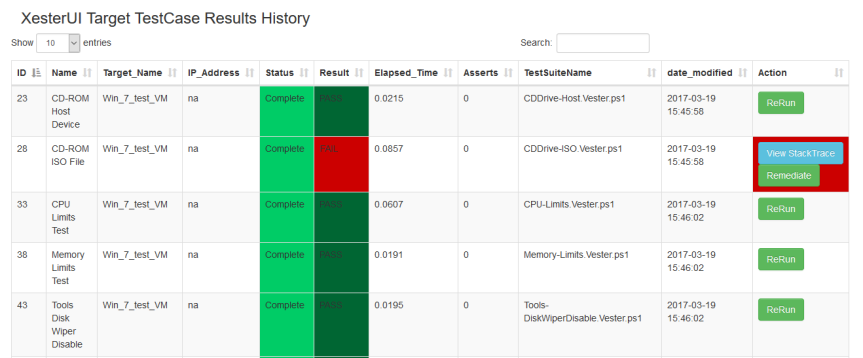
From the TestSuite page, you are able to drill down and view the Testcases:
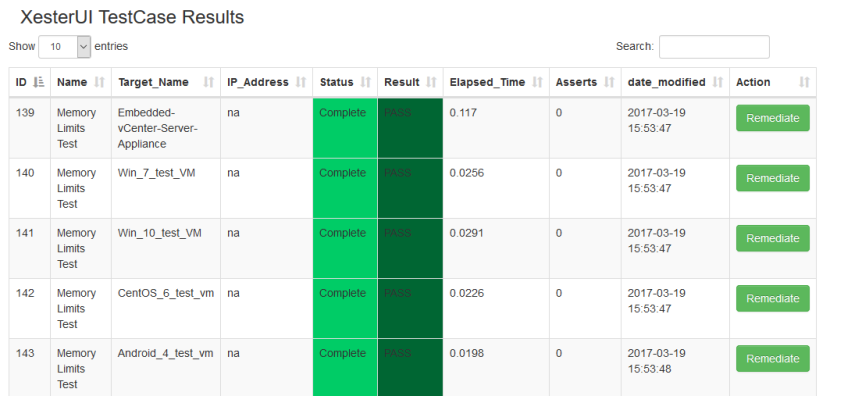
On most of the UI pages you are able to sort any column and filter on strings. If a test case has failed, you are able to view the stack trace, and are able to resubmit the test with the remediate flag.

Submitting a new TestRun is easy, Click the Systems link, and in the row of the system you’d like to test, enter a TestRun name, specify if you want to remediate, and click ‘Submit TestRun’.
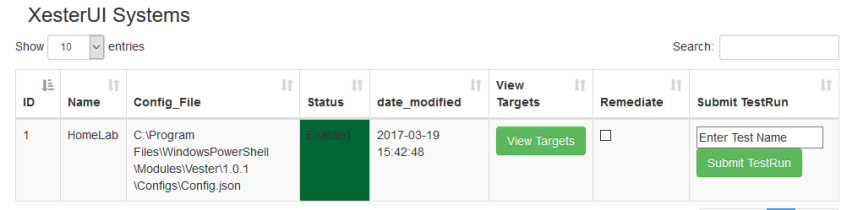
You are also able to view the targets from a specified system or all systems.
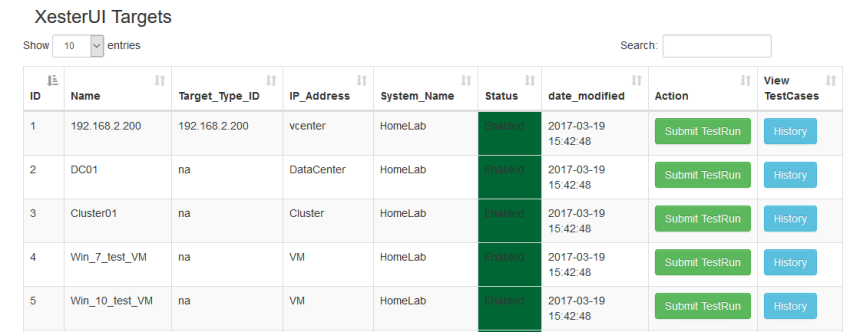
Additionally, if you click on a target you have the option to view all previous TestRuns and the results.
Creating a new System and Target are easy, simply fill out the supplied forms.


Lastly, you can view the Queue Manager and TestRun manager log files from their respective pages. Additionally you can shutdown the Managers. There is a ticket in to be able to start those components. The log files for TestRuns and the manager are stored in ‘c:\XesterUI\component‘ (Queue_Manager, TestRun_Manager, TestRuns\TestName_ID).


Hopefully this gives you an overview of all the features of this tool, and how it can be useful to have all of that data in a searchable/sortable format. Note that Targets do not need to be populated into the DB before you run your first test (with exception of a vCenter). If a target does not exist, it will be created when the XML is being converted and results inserted into the DB.
Upcoming Features:
- Build config files on the fly for an individual ‘target’ or groups of ‘targets’.
- Mulitple vCenter’s per system.
- Ability to create a config.json file by clicking through the web.
- Creating a useful exportable report (potentially email reporting).
- Ability to abort a test.
- vCenter config.json files are more appropriate than ‘System’ config files.
Feel free to review open issues and request features.
Known issues:
Currently a problem with the SMTP check not returning a vCenter ‘Target’ in the XML. This causes a problem with inserting the data into the DB. I know the Target is a vCenter, but I am not given the Target name. I’ll work on tracking down why that’s missing.
Security:
I’m not a security expert. So taking a look at WAMP best practices might be prudent in your environment. I can certainly give you advice, but do your due diligence and make sure you are meeting your organizations goals for security. There are several area’s of this product that could present a security risk. Keep in mind this project is currently in beta, and will continue to grow in maturity over time. Let me know if you have any questions or concerns.
